


Summary

Big Data
◆ in the information age, computers store a large amount of information, including video, audio, pictures, documents and numbers. These information are usually called "big data". Comprehensive analysis of these data can enable us to better understand the laws of things and make the changes of things develop in a direction conducive to us.

Big Data Features
◆ Data range big: if you depict the data in two-dimensional plane or three-dimensional space, you will see a large range.
◆ Data density high : each group of data is regarded as a point. The distance between points is small or even coincident, so the density is high.
◆ Data changes complex : because of the large range of data, irregular changes and many influencing factors, it is more difficult to establish a mathematical model.

Data Planning
◆ Delimit the scope of analysis: when analyzing big data, select the appropriate data range according to the purpose, and conduct data analysis within this range.
◆ Determine the analysis cycle: the data of any process is accumulated for many years. How long the analysis cycle is crucial, otherwise the analysis results will be affected.。
◆ Clarify the analysis purpose: Clarify the analysis purpose: take the analysis purpose as the goal, select the analysis scope and analysis cycle.
prospect

Laboratory
Experiment is a method to study the law of things. Graphing these data, making pie chart, histogram, broken line chart or regression into mathematical model can provide basis for solving practical problems.

Engineering Design
In engineering design, a lot of calculations are needed. These calculations rely on data and charts. Returning these data or charts regression to mathematical model can simplify the design process.

Instrument Manufacturing
Instrumental analysis is a means to test the characteristics of substances, but what the instrument detects is a set of data, which needs to be analyzed and processed with corresponding methods in order to know the results.

Production Control
The quality of products must be guaranteed to be qualified, all links of production must be monitored, the factor data affecting quality shall be collected, comprehensive analysis shall be carried out, and the law shall be found out to avoid the occurrence of quality nonconformity.

System Process Analysis
System is an environmental scope. It has different states under the action of different factors over time. In order to make this state conducive to our needs, it is necessary to comprehensively analyze the data of this process.
product
QCC-Quality Control Chart
◆ The first control chart the P control chart proposed by Dr. Shewhart of Bell laboratory. Since then, the control chart has become an important tool of scientific management. It is a chart with control boundary, which is used to distinguish whether the cause is accidental or systematic, so as to judge the controlled state of the production process.
◆ The control chart is divided into metering control chart and counting control chart according to the purpose. the control chart is used to analyze whether the production is in a stable state. It is chart to distinguish between normal fluctuation and abnormal fluctuation.
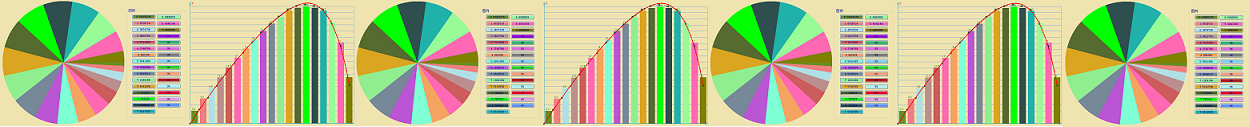
DRS-Data Regression Analysis
◆ The purpose of data regression analysis is to synthesize a series of relevant data into a mathematical equation, and then apply the equation to similar events for prediction.
◆ The fitting method of "least square method" developed by Gauss and Legendre in the early stage,Since then, this method has been widely used,In view of the shortcomings of this method in fitting nonlinear data, In 2001, our studio developed "New square method",It makes linear regression,Nonlinear regression and multiple nonlinear regression, The calculation is simpler and the result is more accurate.

SPA-System Process Analysis
◆ The system is a relatively independent range, which makes the system present different states under the action of several conditions over time. In order to make this state meet people's needs, conditional factors are controlled to meet people's needs.
◆ Any system is a part of a larger system, and it also has several subsystems.
◆ The system is ubiquitous and has various forms. It is of great significance to analyze the system.
◆ SPA is a system analysis tool compiled according to the methods of "new square method" and "dynamic local analysis" etc.
COMMUNICATE

BDA
Language: Simplified Chinese
Size: 37.9 MB
Description:Big data analysis system
(BDA) is a collection version of
quality control chart (QCC), data
regression analysis (DRS) and system
process analysis(SPA).
 COMMUNICATE

QCC
Language: Simplified Chinese
Size: 27.3 MB
Description:Quality control chart
(QCC) is a quality control tool
prepared according to the
national standard of the people's
Republic of China "GB_T_4091-2001".
COMMUNICATE

DRS
Language: Simplified Chinese
Size: 34.1 MB
Description:Data regression analysis
(DRS) was prepared according to
"New Square Method". It makes the
regression calculation of one-
dimensional and multi-dimensional
linear and nonlinear data simpler
and the result more accurate.
COMMUNICATE

SPA
Language: Simplified Chinese
Size: 36.8 MB
Description:System process analysis
(SPA) is a tool to analyze the data
of various relationships within a
system, establish mathematical
relationships and calculate. It
is widely used in practice.
COMMUNICATE
service

PROJECT:Continuous production quality real-time monitoring
In petrochemical production, the processing of raw materials into products requires a variety of equipment to control multi-point process parameters. Qualified products can be produced after a certain period of time. Product samples are regularly collected manually and sent to the laboratory to test whether the products are qualified. It takes a long time from the completion of production control to the inspection of whether the products are qualified, and the interval between each product inspection is also very long, so there are defects that the quality inspection results lag and the product quality is unknown for a long time. We know that the product quality is related to the process parameters. The process parameters and product quality data are kept intact. The process parameter data and product quality data can be associated into a mathematical algorithm to calculate the product quality in time through the process parameters, so as to reduce the cost and improve the production efficiency.
DETAILS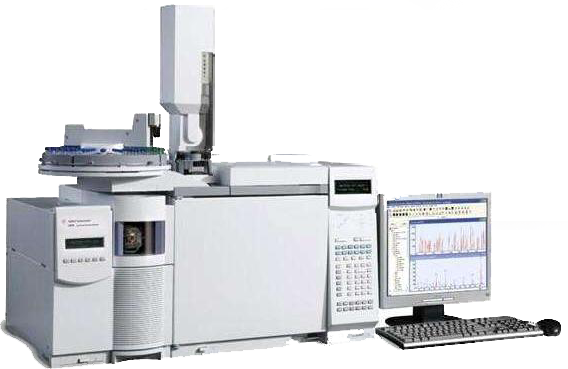
PROJECT:Reanalysis of spectral data
When using chromatography or wavelength technology to detect mixture samples, a series of spectral data are usually obtained. Depicting the data in the coordinate system is a curve. By comparing with the standard sample, the content of a substance in the mixture can be obtained, and the detection is over. However, this group of spectral data is the embodiment of some properties of the mixture, which is related to some properties of the mixture (such as viscosity, density, etc.). According to this idea, when testing the sample, test some properties of the mixture (such as viscosity, density, etc.) at the same time. After such multiple tests, a large number of spectral data and properties data can be obtained by mathematical statistics and other methods, The spectral data and properties data are associated into a mathematical algorithm. When the same new sample is detected, the new spectral data can use the algorithm to calculate the properties of the mixture.
DETAILSabout
HONOR
◆ "New Square Method"to be China Council for the Promotion of International Exchange and China Patent Technology Promotion Center, listed as the 2004 scientific and technological achievements, international patent technologies recommended items.
◆ "New Square Method" participated in the May 20, 2004 China Beijing international science and technology expo .
◆ According to the "New Square Method" developed data regression analysis software-DRS, on March 11, 2011, held the first session of the Hong Kong International Software Contest, was named China Software hundred.
◆ In 2017, published a paper on "New Square Method" in the American Journal of Computational Mathematics and applications. The paper was reprinted on many foreign academic websites and received attention and praise from the academic circles, including the "American Mathematical Society" and the "American Statistical Society".ACADEMIC
USERS
◆ Dalian Institute of Chemical Physics, Chinese Academy of Sciences
◆ Tianjin Railway Third Design Institute
◆ China Academy of inspection and quarantine
◆ Sun Yat sen University
◆ Sichuan fire product quality inspection station
◆ Southwest Petroleum University
◆ Beijing University of science and technology
◆ Harbin Institute of Technology
◆ Nstitute of remote sensing, Peking University
◆ Zhejiang University
◆ Inner Mongolia University
◆ Tianjin University
◆ Chongqing University